A landing page that converted steadily for months starts slipping, and the first instinct is to redesign it. New hero, new copy, new colors. Two months later nobody can say whether the redesign helped, because nobody worked out what was actually wrong.
This is a diagnostic workflow for that moment. Use it to analyze landing page performance in order, because each step rules out a cause before you spend money on the next: tracking, the GA4 Landing page report, segments, Search Console, behavior, speed, and finally tests.
Step 1: Check the Tracking Before You Trust Any Number
Many "the page stopped converting" problems are measurement problems. A form plugin update, a new thank-you URL, a consent banner change or a duplicated tag can move your conversion rate overnight without a single visitor behaving differently.
- Confirm the event fires once. Submit a test conversion with Tag Assistant connected and watch it arrive in DebugView (Admin, then Data display, then DebugView). Make sure a thank-you page view and a form event are not both counting one lead.
- Confirm it is a key event. GA4 now calls conversions key events, and reports only count events you have marked as key events.
- Reconcile with the source of truth. Compare a month of GA4 key events with leads in your CRM or orders in your store. A widening gap points at tracking, not the page.
- Check the date of the drop. If it lines up with a release, a tag manager publish or a consent change, start there.
If consent changes are eating your data, our guide to tracking conversions after the cookie covers server-side tagging and Consent Mode.
Step 2: Read the GA4 Landing Page Report Properly
In GA4, open Reports, then Engagement, then Landing page. The Landing page dimension is the first page of each session, shown with sessions, active users, new users, average engagement time per session, key events and total revenue. If it is missing, an Editor can add it back to the navigation.
The defaults are not enough to diagnose a page. Customize the report, or build a Free-form exploration, and add:
- Session key event rate, the share of sessions with at least one key event. This is your conversion rate.
- Engagement rate. GA4 counts a session as engaged if it lasts longer than 10 seconds, has a key event or has two or more page views. Bounce rate is simply the share of sessions that were not engaged.
- The specific key event. Pick it in the Key events column, so a newsletter signup and a demo request are not counted as the same win.
Compare equal periods: four weeks against the previous four, or the same weeks last year for seasonal pages. A drop in sessions with a steady key event rate is a traffic problem. A drop in the rate with steady sessions is a page or audience problem.
Step 3: Segment by Source and Device Before Blaming the Page
Never analyze landing page performance on a blended average, because it hides most of the answer. In the Landing page report, add Session source / medium as a secondary dimension, then add comparisons for Device category. Check four splits:
- Channel. Organic, paid search, paid social, email and referral visitors arrive with different intent. If only one channel fell, the page is probably fine and the traffic changed.
- Device. A page that converts on desktop and collapses on mobile usually has a layout, speed or form problem on small screens.
- New versus returning. A fall among new visitors often means a message or trust gap, since returning visitors already know you.
- AI assistant referrals. Visitors from ChatGPT, Perplexity, Gemini, Copilot and Claude can behave differently from search visitors, so look at them separately. Depending on your channel setup they can hide in Referral or Direct, which our guide to unmasking AI traffic in GA4 fixes.
For paid traffic, open Campaigns, then Insights and reports, then Landing pages in Google Ads to see which URLs your ads actually send clicks to. If the problem lives in the campaign rather than the page, our PPC performance audit is the next stop.
Also Read :- how to measure AI search ROI when the clicks disappear
Step 4: Analyze Landing Page Performance in Search Console
For organic landing pages, Search Console shows what promise the page made before the click. Open Performance, then Search results, add a Page filter for the exact URL and switch to the Queries tab.
- Intent mismatch. If the top queries ask a question the page never answers, or compare options it never mentions, visitors leave because the page is off target, not because the design is weak.
- Low CTR at a good position. Plenty of impressions and a decent average position but few clicks points at the title and snippet, or at an AI Overview or other feature answering the query on the results page.
- Falling position. If the conversion drop is really a drop in organic sessions, check whether a competitor, an algorithm update or one of your own pages took the ranking.
Linking Search Console to GA4 adds the Google Organic Search Traffic report, which shows Search Console metrics next to Analytics metrics for each landing page. That report collection is unpublished by default, so publish it from the Library first.
Step 5: Watch Real Behavior With Funnels and Recordings
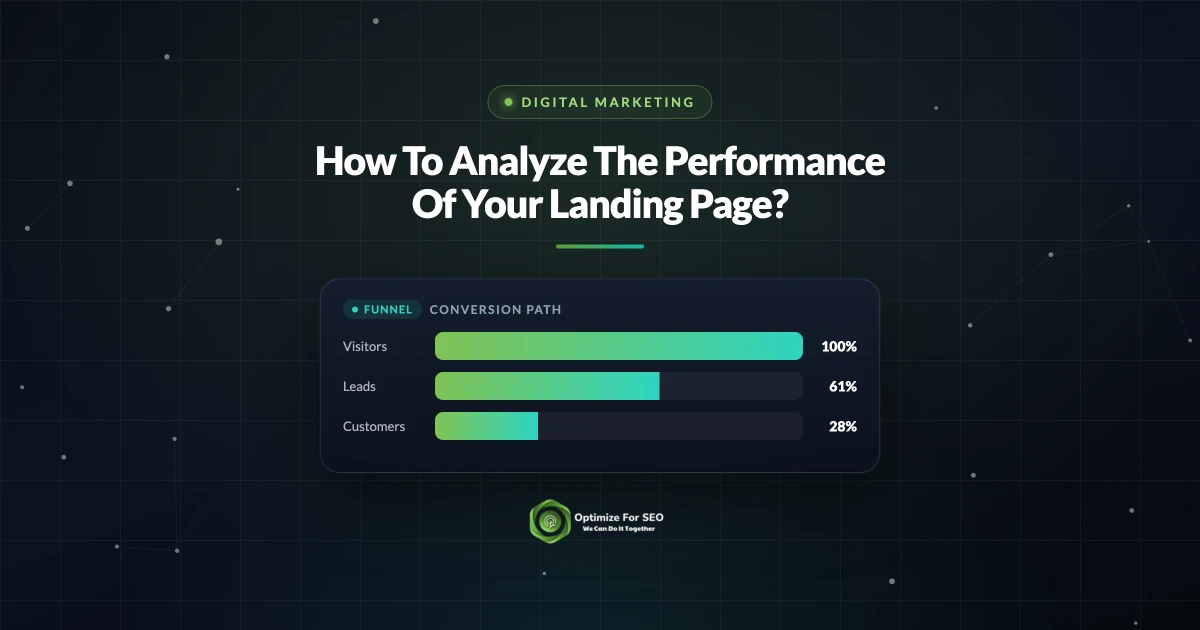
Numbers tell you where people drop. Behavior tools tell you why. Start with a GA4 Funnel exploration built from events you already collect: page_view on the landing page, scroll (enhanced measurement fires it when a visitor reaches 90 percent of the page), form_start, form_submit and your key event. The step with the steepest fall is where to look.
Then open a heatmap and session recording tool. Microsoft Clarity is free and flags these patterns automatically:
- Rage clicks: repeated rapid clicks in one spot, often on something that looks clickable but is not.
- Dead clicks: clicks that get no response, which can mean broken elements or slow requests.
- Excessive scrolling: visitors scrolling up and down hunting for something they cannot find.
- Quick backs: visitors who click away and return almost at once, because the link did not give them what they expected.
Filter recordings to the landing page, the weak segment from Step 3 and sessions without a conversion, then watch 15 to 20 of them and write down every moment of hesitation.
Step 6: Rule Out Speed and Stability
Speed is the easiest cause to check. Run the URL through PageSpeed Insights and read the field data from real Chrome users first, not only the lab score. Google's Core Web Vitals and their "good" thresholds, measured at the 75th percentile of page loads, are:
- Largest Contentful Paint: 2.5 seconds or less.
- Interaction to Next Paint: 200 milliseconds or less.
- Cumulative Layout Shift: 0.1 or less.
If a page has too little traffic for its own field data, the Core Web Vitals report in Search Console groups similar URLs. We explain the metrics in Core Web Vitals and what still moves rankings and the business case in site speed as a conversion lever.
Step 7: Turn Findings Into A/B Tests
Each finding becomes a hypothesis with a cause, a change and a metric. For example: "Recordings show mobile visitors from paid social abandoning at the phone field, so making it optional should raise session key event rate for that segment." That sentence tells you what to build and how to judge it.
- Prioritize by the size of the drop, the traffic affected and the effort. A broken mobile form beats a headline rewrite.
- Fix bugs, test opinions. Broken buttons, tracking errors and slow scripts just get fixed. Copy, layout and offer changes get tested.
- Change one thing per test and set the primary metric and sample size before you start.
- Run full weeks so weekday and weekend visitors are both represented, and do not stop the day one version pulls ahead.
- Re-measure the same segment. When the test ends, analyze landing page performance again for the segment you targeted, not the whole page average.
Google Optimize shut down on September 30, 2023, so tests now run through a dedicated A/B testing tool or your platform's built-in feature. When the fix is structural, our guide to designing landing pages that convert and rank covers the build side, and reducing wasted ad spend with better landing pages covers message match for paid traffic.
If a page needs a rebuild, our website development team can help, or you can ask us for a landing page review.
Frequently Asked Questions
How do I analyze landing page performance in GA4?
Open Reports, then Engagement, then Landing page, and add session key event rate and engagement rate to the table. Add Session source / medium as a secondary dimension and compare devices. Check that your key event fires correctly first, because a tracking change can look exactly like a conversion drop. Then build a Funnel exploration to find where visitors leave.
What is a good conversion rate for a landing page?
There is no universal number worth chasing. Rates vary widely by industry, offer, price and traffic source, so a cold paid social visitor and a returning email subscriber should never share a target. Compare each page with its own history and with your other pages fed by the same channel, and investigate drops rather than chasing benchmarks.
What is the difference between engagement rate and bounce rate in GA4?
They are opposites. An engaged session lasts longer than 10 seconds, includes a key event or has two or more page views. Engagement rate is the share of sessions that meet any of those conditions, and bounce rate is the share that do not. A low engagement rate on a landing page usually signals a gap between the promise and the page.
Why does my landing page get impressions but few clicks?
Check the Queries tab in Search Console for that page. If the average position is good but click-through rate is low, the title and description may not match what people searched, or an AI Overview or other result feature may be answering the query on the results page. Rewrite both for the main queries and recheck after a few weeks.
How long should a landing page A/B test run?
Run it until you reach the sample size you calculated before starting, and for at least one or two full weeks so every weekday is represented. Stopping the moment one version pulls ahead produces false winners. Low-traffic pages may never reach a reliable result, so fix obvious problems directly and test only on pages with steady conversions.
Want this handled for you? Our SEO services agency can help you grow your organic traffic and revenue.
Aashirvad Kumar
Writes about SEO, digital marketing and growth at Optimize For SEO.