ecommerce case study
E-commerce Case Study: $1.9M Revenue in 365 Days with Year-Round SEO and Ads
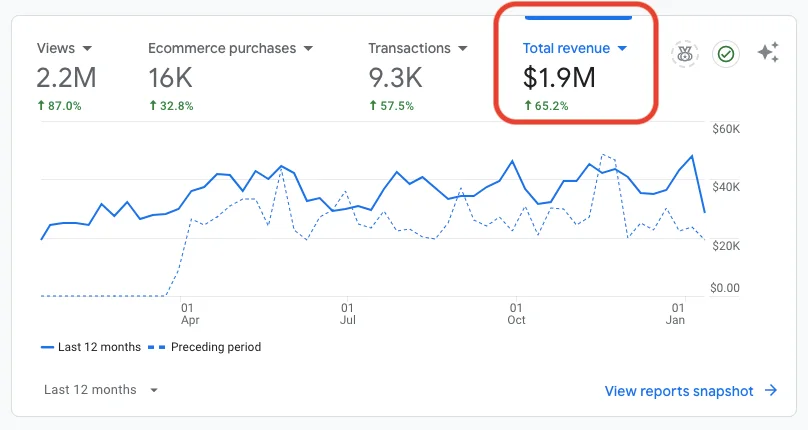
A good month can come from one sale. A good year needs a store that keeps selling week after week. This case study covers 12 months of work for an e-commerce brand that is not named here, and it shows the full year as Google Analytics 4 recorded it, including one number we deliberately do not use as the headline.
Across 365 days of SEO, performance advertising and conversion testing, the brand generated $1.9 million in revenue from about 9,300 transactions, an average order of roughly $204. Revenue grew by about 50% on the year before.
About the project
- Client: an e-commerce brand that was scaling, kept anonymous here.
- Engagement: 12 months, managed month over month, over a January to January year.
- Channels: SEO, performance advertising and continual testing of pages, offers and checkout.
- Goal: steady growth across the whole year rather than a few big months.
Google Analytics 4, last 12 months compared with the preceding period
Twelve months in GA4
| Metric | Result |
|---|---|
| Total revenue | $1.9M (GA4 shows +65.2%) |
| Transactions | 9.3K (+57.5%) |
| Ecommerce purchases | 16K (+32.8%) |
| Views | 2.2M (+87.0%) |
| Average order value | about $204 |
| Average revenue per week | about $36,500 |
Average order value is total revenue divided by transactions. GA4 counts ecommerce purchases and transactions in different ways, so the two numbers do not match. We use transactions for order value because each one is a single order.
Why we quote 50%, not 65%
GA4 reports revenue up 65.2% on the preceding 12 months. That figure flatters the result. In the preceding period, GA4 recorded no revenue at all until around March, so roughly the first two months of the comparison year count as zero.
- The gap inflates every comparison. Revenue, transactions and views are all measured against a year with missing weeks at the start.
- Our records give a fairer figure. Optimize For SEO project records put revenue growth for the year at about 50%, and that is the number we use in the headline.
- The revenue total is not affected. The $1.9M covers the full 12 months of the program, with tracking in place throughout.
What a steady year looks like
Weekly revenue started the year near $20,000, climbed to between $35,000 and $45,000 by spring, and stayed mostly between about $30,000 and $45,000 for the rest of the year. The strongest weeks came close to $50,000, in early October and again in early January. No single season carried the year, and that steadiness is what made the total possible.
Bigger baskets, more browsing
The comparisons are inflated by the tracking gap, but they all share the same base, so how they move against each other is still useful.
- Orders got larger. Revenue grew faster than transactions, which means the average order rose by roughly 5%.
- Shoppers looked at more pages. Views grew faster than transactions, to about 240 page views for every order. More browsing per order is normal as a store adds products and category pages for buyers to compare.
- Offers were part of the test plan. Offers such as bundles and free shipping thresholds are designed to raise order value, which fits the rise in average order size.
The year-long program
- Ongoing technical healthTechnical SEO was kept in good shape all year, so the store stayed easy to crawl as it grew.
- Wider commercial keyword coverageThe SEO work kept adding commercial keywords, to grow organic revenue through the year.
- Stronger product and category pagesProduct and category pages were improved so they could compete for those searches and turn visits into orders.
- Campaigns around best-sellersPerformance campaigns were built around best-sellers and high-intent audiences.
- Month-over-month managementBudgets and campaigns were reviewed every month toward return on ad spend, so advertising stayed profitable as it scaled.
- Testing pages, offers and checkoutPages, offers and the checkout were tested continually, so a larger audience still converted well.
Checking your own year-over-year numbers
The tracking gap in this account is common. Before you trust a year-over-year figure in GA4, run these checks.
- Look at the comparison line, not just the percentage. A flat line at zero at the start of the earlier period means missing data, not missing sales.
- Pick one purchase metric and stick to it. Transactions and ecommerce purchases count differently. Mixing them makes order value meaningless.
- Check revenue against your store platform. Your store's own sales report is the record of what was actually sold.
- Note tracking changes. Keep a dated log of tag, theme and checkout changes, so a jump in the data can be explained later.
Want results like these?
Planning for a full year of growth? See our e-commerce SEO services and SEO services pages, or talk to Optimize For SEO about a program reviewed every month. For a shorter engagement at a large store, see the $303K in 60 days case study.
Results: Google Analytics 4 reports snapshot for the last 12 months compared with the preceding period, plus Optimize For SEO project records for this 365-day program. Average order value, weekly averages and views per order are worked out from those figures. The brand is not named in this case study.