ecommerce case study
Shopify Case Study: $21K Revenue in 7 Days at a 5.43% Conversion Rate
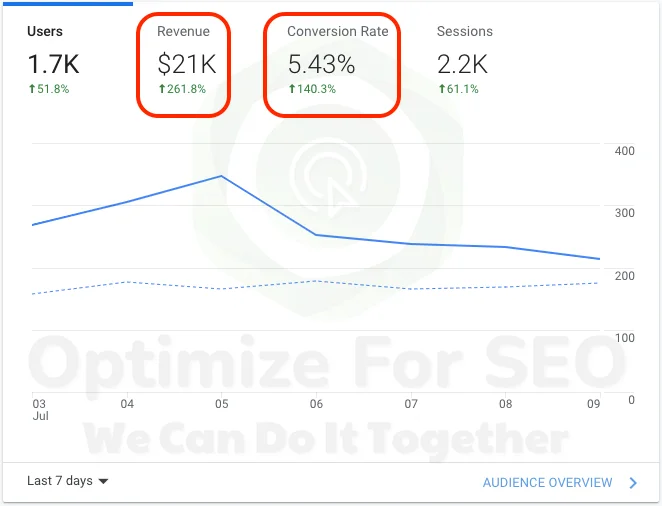
This Shopify brand was small and already paying for traffic. A few hundred visitors a day reached the store, but only about one in 44 sessions ended in an order. The question was simple: could the same kind of traffic be made to buy? The brand is not named in this case study.
Over one 7-day sprint, from 3 to 9 July, Optimize For SEO worked on search, paid campaigns and the store itself at the same time. Revenue reached $21,000, up 262% on the week before, and the conversion rate rose to 5.43%.
About the project
- Client: a Shopify brand, kept anonymous here.
- Window: 7 days, 3 to 9 July, measured against the 7 days before.
- Starting point: paid traffic already arriving, with a conversion rate of about 2.3%.
- Channels: SEO, paid advertising and conversion rate optimization.
Google Analytics, sprint week compared with the week before
Week over week: the full picture
| Metric | Sprint week |
|---|---|
| Revenue | $21K (+261.8%) |
| Conversion rate | 5.43% (+140.3%) |
| Sessions | 2.2K (+61.1%) |
| Users | 1.7K (+51.8%) |
| Revenue per session | about $9.50, up from about $4.25 |
| Orders (estimated) | about 120, up from about 30 |
The week-before figures and the order counts are worked out from the percentages Google Analytics reports. For example, $21K is 261.8% more than about $5,800, and 2.2K sessions at 5.43% is about 120 orders.
Where the extra revenue came from
Revenue in a store is sessions, times conversion rate, times average order value. Splitting the result that way shows which lever did the work.
- Traffic: up 61%. More sessions alone would have lifted revenue by about 61%.
- Conversion: more than doubled. The rate went from about 2.3% to 5.43%. This is the main reason revenue rose 262% rather than 61%.
- Order value: about the same. The average order stayed in the same range, roughly $175 to $190, so bigger baskets were not the cause.
In short, most of the gain came from turning more of the visits into orders, not from buying more visits.
Day by day
In the week before the sprint, the store saw roughly 165 to 185 users a day. During the sprint daily users climbed for three days, to a high of about 350 on 5 July, then settled between about 220 and 255. Even after the peak, every day stayed well above the level of the week before.
What we changed during the week
- SEO on the pages that sell fastestWe prioritized the pages and commercial keywords most likely to bring in buyers quickly.
- Rapid campaign launchPaid campaigns went live around the store's best-sellers and intent-based audiences.
- Daily optimizationCampaigns were adjusted every day toward return on ad spend, so budget kept moving to what was selling.
- Landing page refinementsQuick changes to the pages shoppers arrived on, so visitors from ads and search could find what they came for.
- Clearer calls to actionThe next step was made obvious on the pages that mattered most.
- Checkout fixesWe removed friction at checkout, the last place a paid visit can be lost.
How to read a 7-day result
A one-week sprint is a test, not a verdict. Before scaling from a result like this, check three things.
- Sample size. About 120 orders is enough to see a clear direction, but not enough to rule out a lucky week. Confirm it over the next month.
- Like-for-like days. Compare the same days of the week, and watch for holidays or sales that would lift any store.
- Order value. A higher conversion rate that comes from heavy discounts can shrink the average order. Here order value held, which suggests the lift was not bought with deep discounts.
For a very different situation, a large store keeping its conversion rate while traffic grew, see the $303K in 60 days Shopify case study.
Want results like these?
If you pay for traffic that is not converting, start with the store before you raise the budget. See our Shopify SEO agency and e-commerce SEO services pages, or get in touch with Optimize For SEO for a plan tailored to your store.
Results: Google Analytics audience overview for 3 to 9 July, compared with the previous 7 days, plus Optimize For SEO project records. Week-before figures, order counts, order values and revenue per session are estimates worked out from those figures. The brand is not named in this case study.