ecommerce case study
Shopify Case Study: $303K Revenue in 60 Days at a 4.72% Conversion Rate
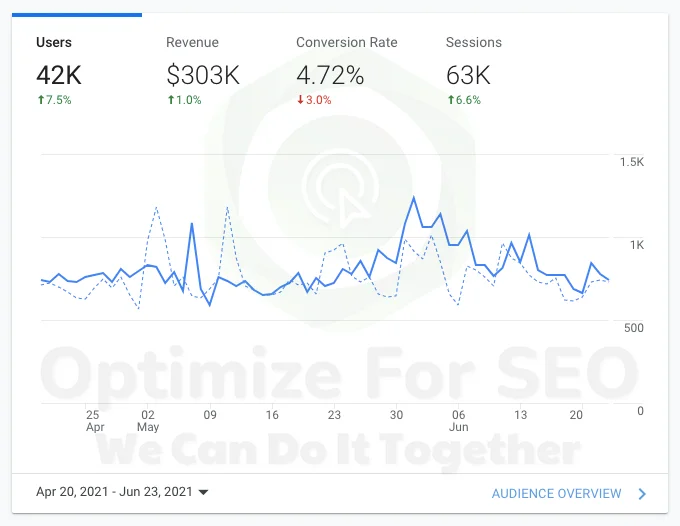
Most case studies are about a spike. This one is about holding a high conversion rate while a store is already busy. The Shopify store in this project was doing real volume: up to about 1,000 users a day and roughly 3,000 orders in the period. The job was to keep that traffic converting as more of it arrived. The brand is not named in this case study.
Over a focused 60-day engagement in spring 2021, Optimize For SEO ran SEO, performance advertising and conversion work as one plan. The store generated $303,000 in revenue from 63,000 sessions, at a 4.72% conversion rate.
About the project
- Client: a Shopify store with products that already sold, kept anonymous here.
- When: spring 2021. The analytics view runs from 20 April to 23 June 2021.
- Size: a store at scale, with daily users mostly between about 700 and 1,000.
- Channels: SEO, performance advertising and conversion optimization.
Google Analytics, compared with the previous period of the same length
The numbers behind $303K
| Metric | Result |
|---|---|
| Revenue | $303K (+1.0%) |
| Sessions | 63K (+6.6%) |
| Users | 42K (+7.5%) |
| Conversion rate | 4.72% (-3.0%) |
| Revenue per session | about $4.80 |
| Orders (estimated) | about 3,000 |
| Average order value (estimated) | about $100 |
The last three rows are worked out from the figures above. Sessions multiplied by the conversion rate gives roughly 2,970 orders, and $303K divided by that gives an average order of about $100.
Reading the result honestly
Revenue in this window was level with the period before it, up 1.0%. This was a large store holding its ground at scale, not a store going from small to big in two months.
- More visitors came in. Sessions rose 6.6% and users rose 7.5%.
- The conversion rate barely moved. It slipped 3.0% in relative terms, to 4.72%. New traffic usually includes more first-time visitors who are not ready to buy, so some dip is normal.
- Revenue held. The store kept making about $4.80 for every session while it took on more traffic.
For a store at this size, that is the hard part. Traffic can be bought. Adding traffic without losing the rate it converts at takes work on the pages, the campaigns and the checkout at the same time.
What the daily trend shows
In the period before, daily users came in sharper spikes, twice reaching about 1,200, with quieter days between. In this window traffic was steadier, then built into a stronger run from late May to mid-June, with a high of about 1,250 users around the start of June. Steady traffic is easier to plan stock, ad budgets and staffing around than a few big days.
What we did
- Technical fixesWe fixed technical issues on the store, so search engines could crawl and index the pages that matter for sales.
- Product and category pagesWe strengthened the pages shoppers land on from search, since these pages carry most of the buying intent.
- Commercial keywordsSEO targeted searches from people ready to buy, not just people browsing.
- Campaigns rebuilt around top productsAd campaigns were restructured around the store's best-sellers and intent-based audiences.
- Return on ad spend as the targetAfter the rebuild, campaigns were optimized toward return on ad spend, so budget followed revenue.
- A smoother path to checkoutWe streamlined the journey to checkout, sharpened calls to action and added trust signals, which kept the conversion rate at 4.72% as traffic grew.
Lessons for stores already at scale
- Watch revenue per session, not just the conversion rate. It combines conversion and order value in one number, and it tells you whether new traffic is paying its way.
- Expect a small dip when traffic grows. A slight fall in conversion rate while sessions rise is normal. A large fall means the new traffic is the wrong traffic.
- Prefer a steady line to a spiky one. A few big days look good in a report but are harder to repeat.
- Work every channel together. Search, ads and the store itself all decide whether a visit becomes an order.
Compare this with a much smaller store, where conversion was the main lever: the $21K in 7 days Shopify case study shows revenue rising 262% in a week.
Want results like these?
If your store already has traffic and you want more of it to turn into orders, see our Shopify SEO agency and e-commerce SEO services pages, or talk to Optimize For SEO about a plan built around your numbers.
Results: Google Analytics audience overview for 20 April to 23 June 2021, compared with the previous period of the same length, plus Optimize For SEO project records. Order count, average order value and revenue per session are estimates worked out from those figures. The store is not named in this case study.